Much of the functionality available from the Columns panel is also available from the Tables panel; whether you choose to manage column visibility and metadata from the Tables or Columns panel will largely depend on personal preference.
Like the Tables panel, the Columns panel allows you to configure columns by managing their visibility, assigning data categories that will enable certain functionality for end-users, creating measures and multi-measures, assigning formatting to measures, and sorting columns and measures into display folders. Unlike the Tables panel, you can also manage column sorting here.
Columns page
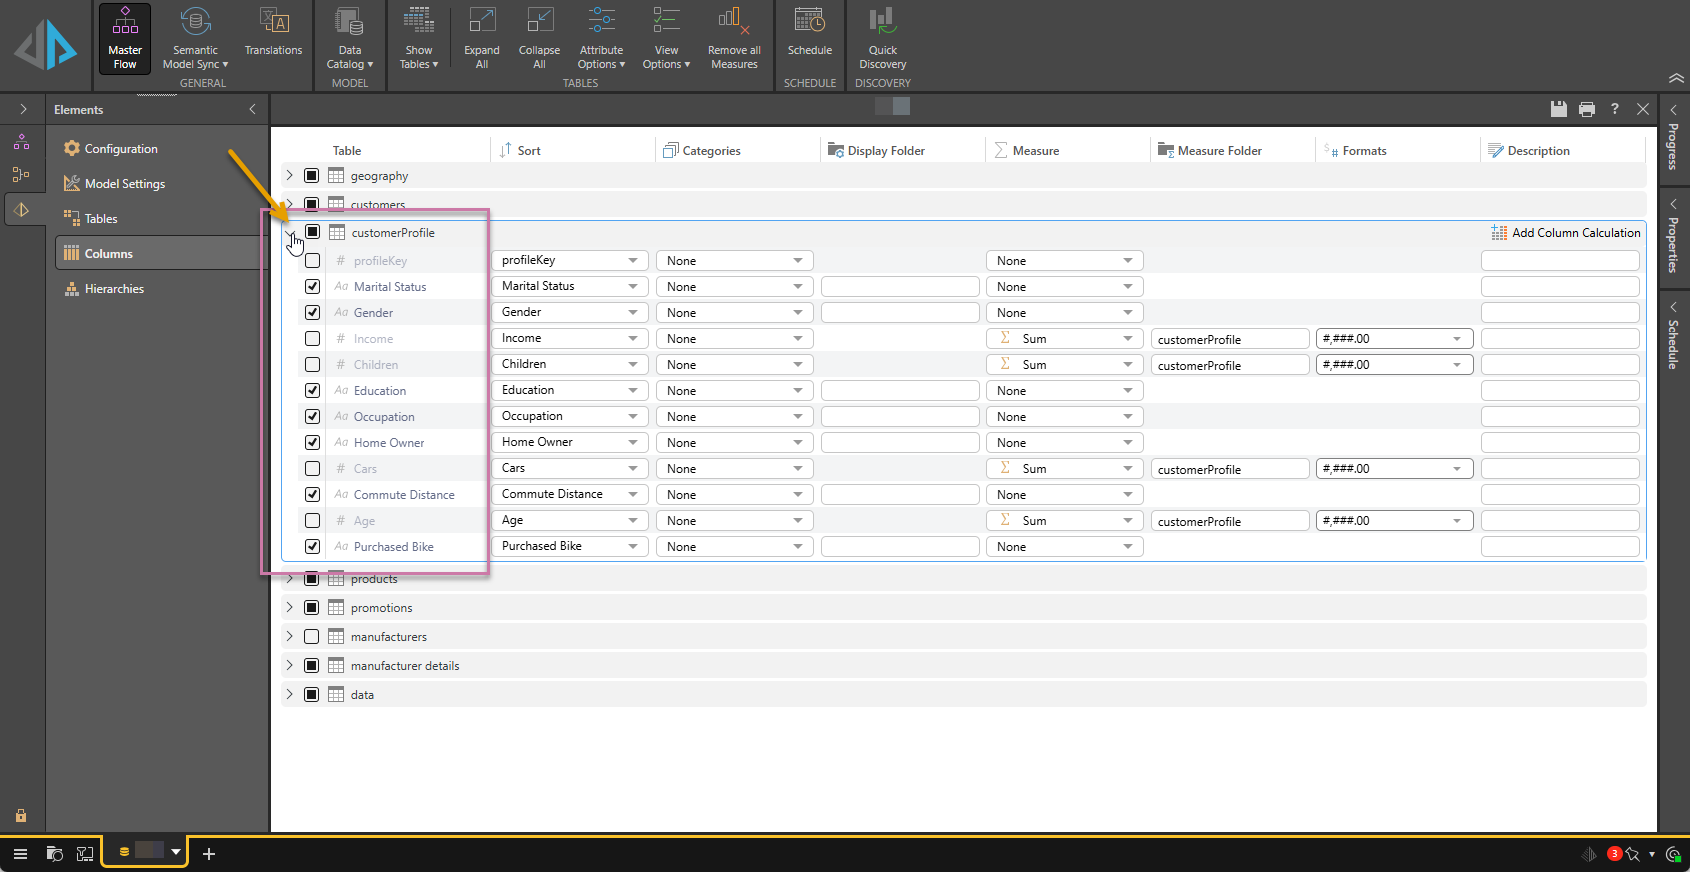
Table
The first column (purple highlight above) shows each of the columns within each table. When you Expand the table (orange arrow) you can view its attributes and make any necessary adjustments.
- Click here for more information
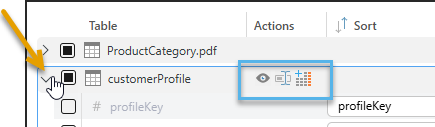
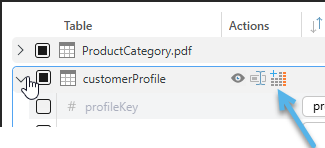
Actions
When the table is expanded (orange arrow below), you can make use of the Actions (blue highlight) for each table. The available actions, from left to right, are Preview, Rename, and Add Column Calculation.
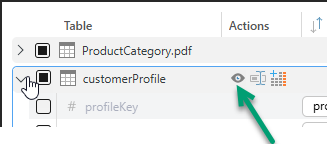
Preview Table
Preview the result set for each table by clicking Preview from the table's Actions column (green arrow below):
The Preview panel opens at the bottom of the page. It shows you a quick sample of the data, so you can easily check what the columns look like and see example values. The preview is limited to the first 50 rows, and you can sort (where available) and filter the preview data as needed.
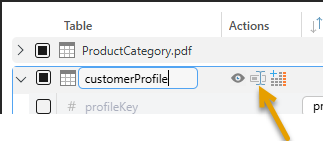
Rename Table
Change the name of the table in the data model by clicking Rename from the table's Actions column (orange arrow below) and typing your new name over the current name:
Add Column Calculation
Add calculated columns to a table by clicking Add Column Calculation from the table's Actions column (blue arrow below):
The Calculated Columns editor, where you can define the logic of the calculation, opens at the bottom of the page. Once a calculated column has been added to the table, it appears as a new row in the list of columns and can be treated like any other materialized column in terms of setting its properties.
- Click here to learn more about creating calculated columns
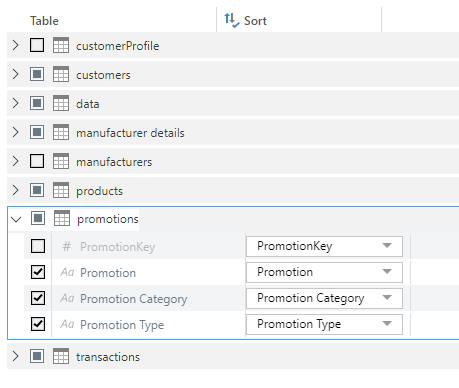
Sort
You can sort a column by another column in the same table by selecting an option from the dropdown list. By default, each column is sorted by its own values.
- Click here to learn more about sorting.
Categories
Relevant columns should be categorized to enable various functions later on, such as map visualizations, and date and time calculations. The categories to choose from include date time, geospatial, machine learning, and custom map files that have been imported via the Admin console. Categories can also be assigned using Pyramid's column categorization AI feature.
The Categories column displays the category assigned to each column:
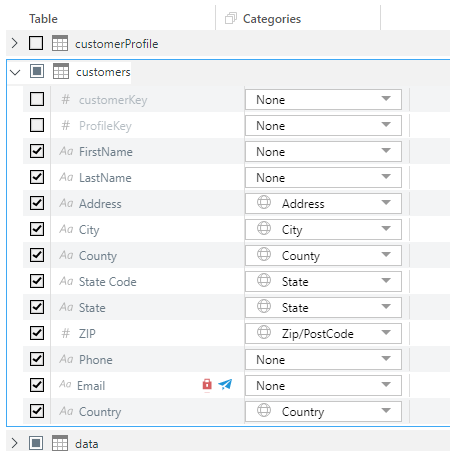
To assign a category to a column from the Columns panel, select the required category from the Categories dropdown list (blue arrow above).
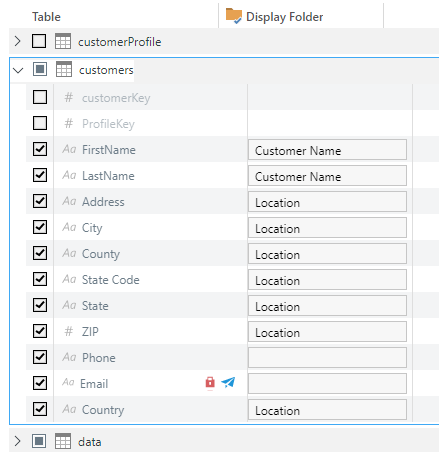
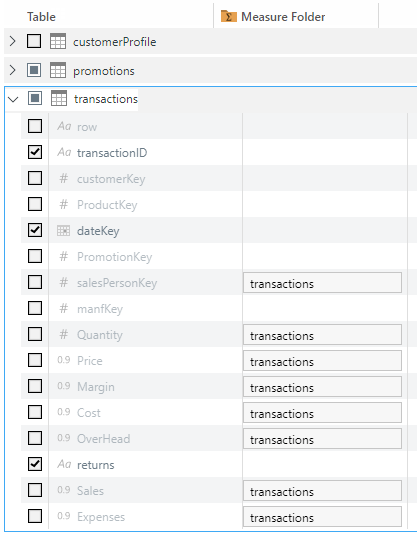
Display Folder
This field allows you to set a folder name for the column. In Discover, columns (referred to as hierarchies) are grouped according to the table (known as dimensions) to which they belong. At this stage of data modeling, users can define additional grouping criteria by placing columns into sub-folders. This can make it easier to navigate large dimensions later on in Discover.
To place columns into folders from the Columns panel, enter the folder name in the column's corresponding Display Folder field:
- Click here to learn more about column display folders.
Measures
Pyramid uses heuristics to automatically detect measures and assign an appropriate aggregation type to them. You can change the measure aggregation type, assign measures to text and date/time columns, assign multiple measures to a column, and more. Change the measure type from the Measure dropdown list, or from the Tables panel.
Measures are displayed from the Measure column; a measure can be assigned to a column by selecting the measure type from the column's corresponding measure dropdown list.
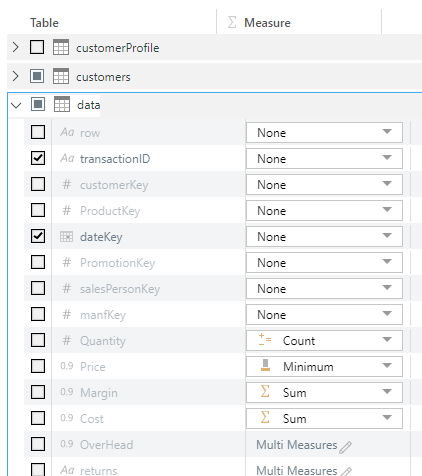
To assign multiple measures to a column, select Add Multiple Measures from the end of the dropdown list (blue arrow above).
- Click here to learn about configuring measures.
- Click here to learn about multi measures.
- Click here to learn about the Multi Measures panel.
Measure Folders
This is the folder where the corresponding measure will be located in the measures tree in Discover.
Measures not added to a measure folder will be auto-grouped into measure group folders in Discover. Measure folders are displayed in the Measure Folder column:
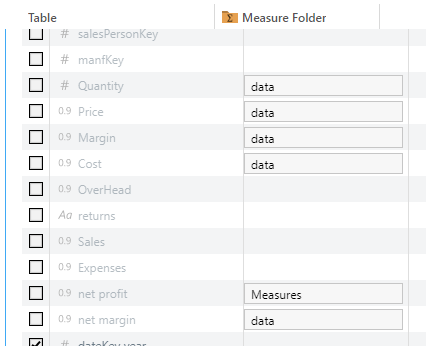
Measure folder names can be changed directly from the column's Measure Folder field:
- Click here to learn more about measure folders.
Formats
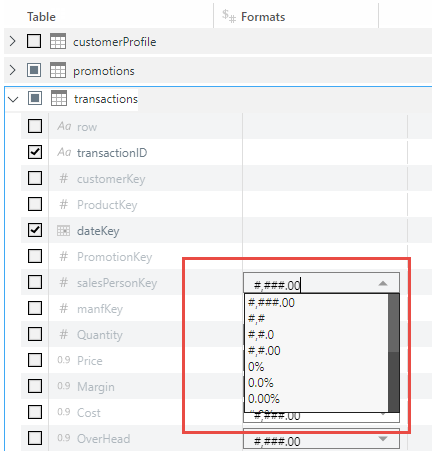
This indicates the format of the measure. Change the format by selecting one of the dropdown options or enter a custom format (red arrow below). Formats can be edited by individual users from Discover; this edits the measure overlay for that user only. Admins can also edit measure formats when editing the measure overlay from the Admin console.
Column formats are displayed in the Formats column:
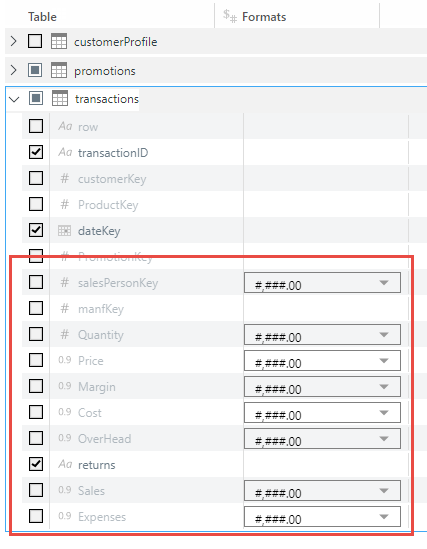
Change a column's format from the corresponding Formats dropdown list:
- Click here to learn more about measure formats.
Description
The Description column provides a short summary of the attribute in the row.
Related information
Column Visibility
Visibility determines which tables and columns will be visible in the data model. Pyramid automatically detects key columns and hides them, so they will not be visible in the data model unless you make them visible.
Pyramid also detects measure columns and assigns a measure aggregation to them. This means that they won't be visible as columns in the data model; instead they will be organized into measure folders and will be visible as measures.
Show or hide a column by checking or unchecking its checkbox.
- Click here to learn more about column visibility.
AI Categorization
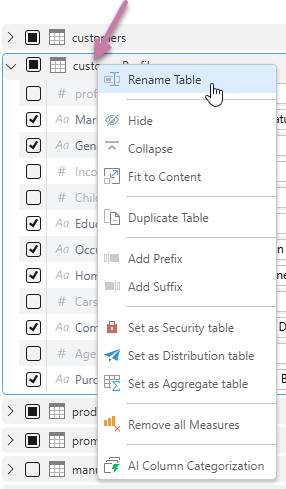
Columns can be categorized using Pyramid's AI column categorization feature. Right-click on the table name (purple arrow below) and select AI Column Categorization from the context menu. The system will generate categories (if applicable) for all columns that have not been assigned to a category.
- Click here to learn more about categories.
Editing Column Metadata
Individual users can change the categories for selected columns from Discover, as well as the column caption (name). They can also change a measure's caption and format. This is called a hierarchy or measure overlay. When a user applies an overlay from Discover, the overlay will be visible to that user only.
However, Admins can assign hierarchy overlays and measure overlays to specified roles, in order to present hierarchies and measures differently to different user roles. Admins can create overlays consisting of an alternative display folder, description, name, category type (for members), and format string (for measures).